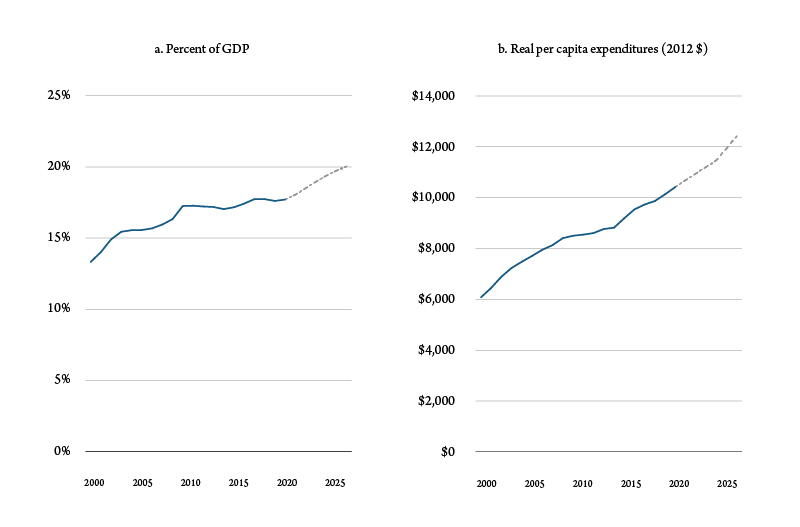
The rapid growth of health care spending in the United States is well documented. According to data from the National Health Expenditure Accounts, in 2019 overall health care spending represented almost 18% of total gross domestic product and inflation adjusted per capita expenditures were $10,400 per year (Figure 1). If current trends continue, over the next five years projected 2025 health expenditures (represented by dashes) will represent one-fifth of total U.S. output, as measured by gross domestic product. Real per capita expenditures will reach of $12,000 per year, more than double what they were at the turn of the century. According to a report by the Bureau of Labor Statistics, over the next several years health care and social assistance will be the fastest growing sector in the U.S. economy.
The reasons for the expansion of health care spending are numerous. The passage of the Affordable Care Act in 2010 reduced the percentage of uninsured Americans from 15.5% to 9.2% in 2019, though at its lowest in 2016 this ratio was 8.6%. This translates into roughly 13 million more people seeking consistent health care today than 10 years ago.
A second driver of this growth is the aging population and longer life expectancy – though this latter indicator has dropped over the past three years or so. Roughly one-half of all health care spending is for people over the age of 55, and individuals over 65 account for one-third of expenditures.
Economists call health a “normal good” – the higher your income the more you demand. Improvements to medical technology, such as pharmaceuticals, devices, etc., have been introduced to satisfy the increased demand for better health outcomes. Another factor is the rise of health risks. For example, the national obesity rate increased from 31% in 2000 to 42.4% in 2018. The rate of severe obesity doubled to 10% over the same period.
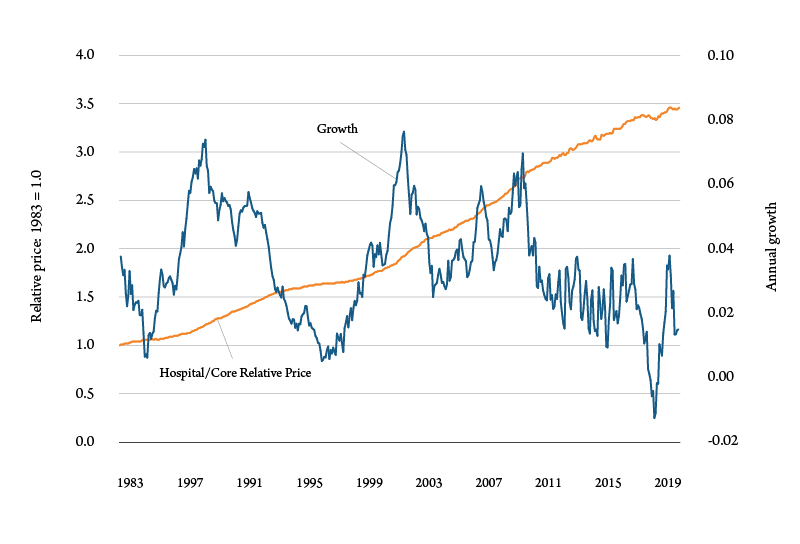
The result of this can be seen by comparing the prices of hospital services to the overall price level. Increased demand for hospital services derived from higher incomes, declining health and preferences can be seen in the ratio of hospital prices to the general price level. Figure 2 shows the annual growth rate of the relationship, which has averaged about 4% since 1983.
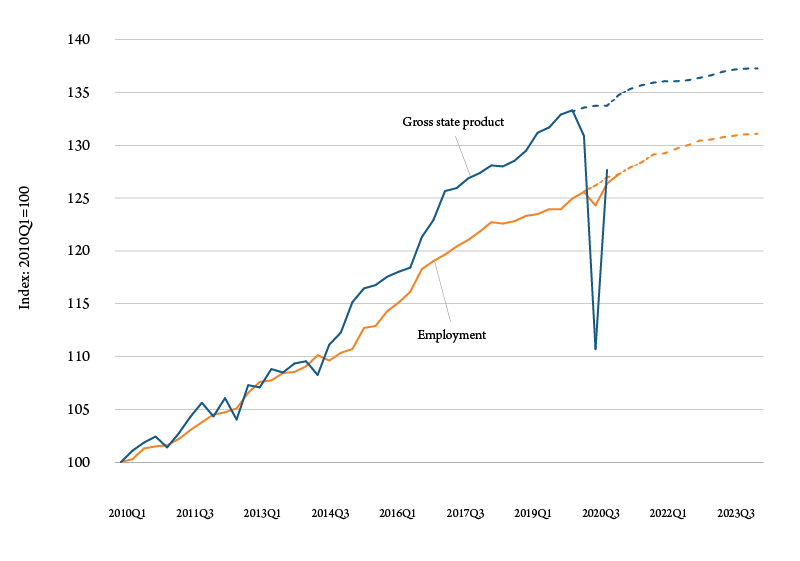
Similar patterns can be found in Montana. Figure 3 shows health care output, measured as gross state product and employment from 2010 to 2023. To calculate the forecasts the model did not include data post-2020Q1 to remove the short term impacts of the COVID-19 pandemic. By the end of 2023 the Montana health care sector will be roughly 30% higher than it was 2010.
Projections by the Congressional Budget Office (CBO) show expenditures in both Medicare and Medicaid will continue to rise through 2031, averaging 6.9% and 5% respectively. By 2031, the CBO estimates the combined spending of both these programs to be roughly $2.1 trillion.
Hospitals in Montana
The Bureau of Business and Economic Research at the University of Montana was contracted by the Montana Hospital Association to conduct an economic analysis of the state’s hospitals and health centers. The results demonstrate a sizable, ongoing and permanent impact of Montana’s hospitals on the economic performance on Montana.
Table 1 shows hospital employment, total wages and salary, and average annual pay in five year increments between 2005 and 2019. Also tabulated are the annual growth rates for those years. Over the 15-year period, employment in Montana hospitals is 28% higher in 2019 than 2005, total wages are an impressive 116% higher, and average pay almost 70% more. To put that in perspective, over the same period, statewide employment, total wages and average annual pay rose 15.8%, 81.9% and 57.1%, respectively.
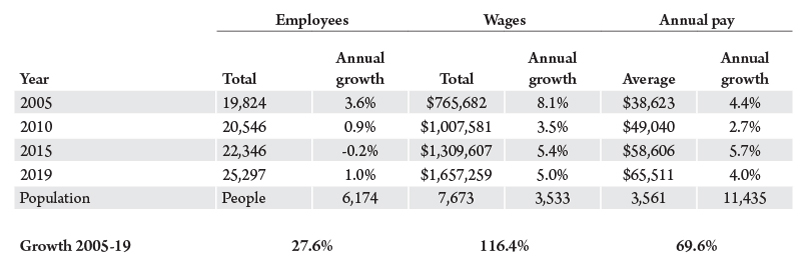
These data demonstrate the growing importance of the health care sector, including hospitals, in the Montana economy. A recent report by the World Health Organization provides evidence for the role the health care sector plays on economic activity.
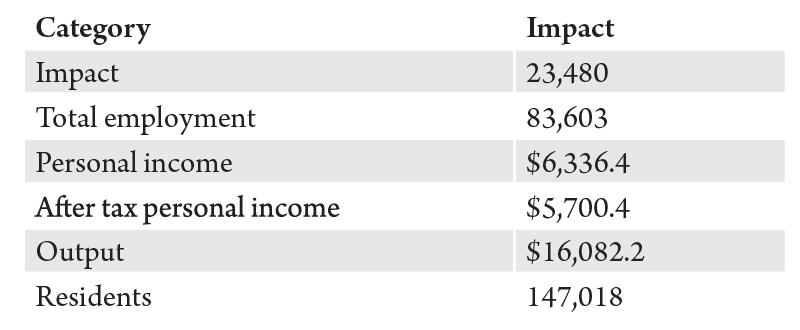
Using data for 55 hospitals and health centers across 47 counties, BBER calculated the economic impact of Montana’s hospitals. Economic impacts by hospitals are the total number of direct and indirect jobs created; total personal income and after taxes, disposable income; economic output created; and total population which results from county hospitals.
Putting that in perspective, Montana hospitals directly and indirectly account for about 17.3% of state employment, 11.9% of total personal income and 13.8% of population.
While there are health centers located in most of Montana’s counties, not all of the rural operations can handle all types of medical emergencies or procedures. Many smaller regional health centers do not have the facilities to conduct complicated procedures. It is also unlikely that a sufficient number of prospective patients would make it cost effective to provide facilities for infrequent procedures. Using outpatient billing data, BBER identified the hospital county destination for all of Montana’s health centers.
As expected, counties with the largest hospitals had the largest billing percentage from outside their home county. For example, Figure 4 shows where Yellowstone County hospitals, Billings Clinic and St. Vincent Healthcare, billed their outpatients in 2019. The data only includes those counties which represented greater than or equal to 0.5% of total billing by Yellowstone hospitals. About 60% of invoiced bills were to Yellowstone residents. Patients from Big Horn County were the source of the largest out-of-county billing. Patients from Lewis and Clark County accounted for about 0.5% of Yellowstone’s hospitals billing.
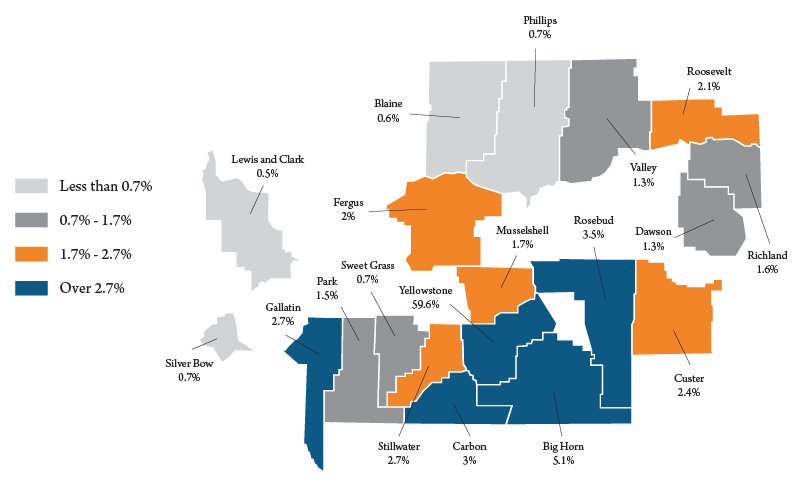
Hospitals in Missoula County had the smallest share of resident billing, accounting for about 53% of the total. As might be expected, most of Missoula hospitals billing was in the western third of the state, while in Yellowstone County patients tended to be from the central and eastern two-thirds of the state.
Other counties which tended to export health services to nonresident patients were Cascade County (66%), Flathead County (73%), Gallatin County (78%), Lewis and Clark County (76%), and Silver Bow County (75%). For states such as Montana, recognizing patient flows is crucial to improving rural health care in the future, such as which services should be provided on-site and what can be provided remotely; recruiting and retaining health care workers; and how to improve affordability.
Health care is on track to continue its high growth rates and become an ever increasing sector in the national and state economies for many years to come. If demographics, health and economic activity remain on the same course, given the considerable effect of Montana’s hospitals on Montana’s economy, the health care sector’s direct and indirect impact will follow national trends. The health care sector in the U.S. is projected to be as high as 20% by 2027, however if we include the indirect impacts, that number increases to roughly 30% of gross domestic product – becoming one of the largest, if not the largest sector in the state’s economy.

