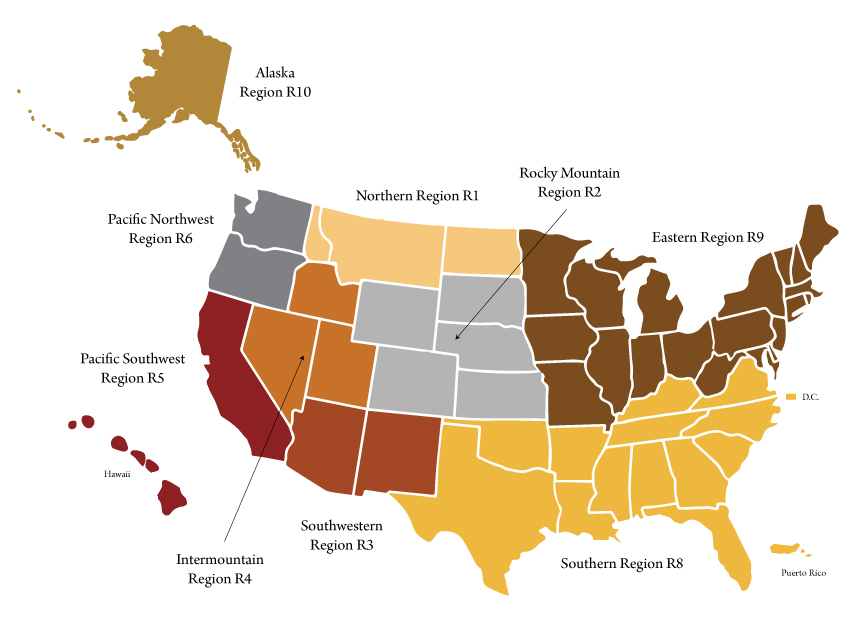
National forests are a major part of the Montana and western U.S. landscape. The 192 million acres of National Forest System (NFS) lands are organized into 175 national forests and grasslands and nine regions (Figure 1). Under the National Environmental Policy Act (NEPA) of 1969, environmental analyses are required before undertaking major actions in the management of federal lands, and the U.S. Forest Service (USFS) devotes substantial effort to conducting NEPA analyses and defending them when they are administratively objected to or challenged in court.

This article presents information about the number and types of NEPA analyses conducted by the agency, how long they take to prepare, and the frequency of litigation by NFS region and project purpose, as well as information on the NFS annual budget and land management accomplishments.
The USFS uses the Planning, Appeals and Litigation System (PALS), a web-based application created in 2004, to manage key information for projects that require NEPA analysis (USDA 2020a). PALS includes information on the number of NEPA analyses by USFS region and analysis type: Categorical Exclusion (CE), Environmental Assessment (EA), and Environmental Impact Statement (EIS); elapsed days to complete each analysis and have it signed; project purposes; and whether the analysis was litigated (Fleischman et al. 2020a, b). Prior analysis indicated that the number of NEPA analyses declined from 2005 through 2019 (Fleischman et al. 2020a).
Researchers in the Forest Industry Research Program at the University of Montana recently completed a study, published in the Journal of Forestry (Morgan et al. 2021), using PALS and other USFS data. Annual USFS budget data (USDA 2020b) for fiscal year 2006 through 2020 were assembled and adjusted for inflation to a 2020 basis (Federal Reserve Bank 2020). Likewise, annual accomplishment data for several NFS programs were collected, including the timber management program (Headwaters Economics 2020; USDA 2020d), as well as the reforestation, wildlife, fisheries, engineering, hazardous fuels, and weeds and invasive species programs (USDA 2020c). Regression models were developed to quantify budget and accomplishment trends and explore the time required to complete NEPA analyses (Morgan et al. 2021).
Budget and Accomplishment Trends
The Washington office of the USFS allocates funding to the nine NFS regions in defined budget line items that have specific intended uses, and detailed guidance on the appropriate use of those funds is in the Forest Service Handbook (USDA 2020b, e).
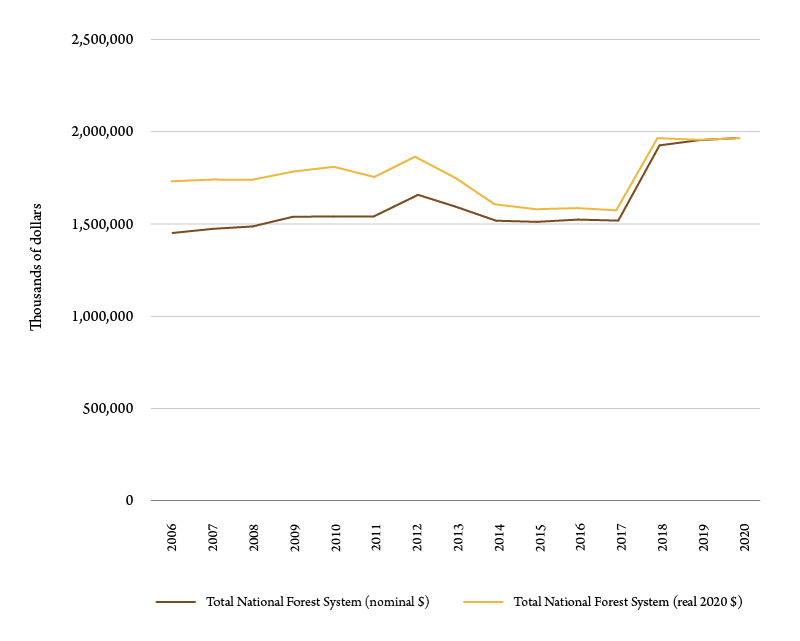
In nominal dollars (not adjusted for inflation), total enacted NFS funding for fiscal years (FY) 2006 to 2020 increased to nearly $2 billion (Figure 2). The average annual compound growth rate in nominal funding for the period was almost 2%. In real (inflation-adjusted) 2020 dollars, the average annual compound growth rate was 0.24%, which suggests a flat budget over the 15-year period.

The accomplishment measures revealed mixed results. There were statistically significant upward trends in timber volume sold, timber volume cut and terrestrial habitat restored; and statistically significant downward trends in acres of reforestation and timber stand improvement. Other measures exhibited essentially flat trends. Regardless, the observed downward trend in the number of NEPA analyses does not appear to have hampered the agency’s ability to complete on-the-ground work, and the declining number of NEPA analyses identified by Fleischman et al. (2020a) does not reflect the NFS budget trend.
Time To Complete NEPA
Given that environmental analysis is important does not exempt it from time management considerations. The time spent on one activity reduces the time available for other activities. USFS personnel time and funds used on NEPA analyses represent opportunity costs to on-the-ground management activities.
PALS data ranged from 2005 through approximately April 2019, with 1,269 NEPA analyses identified as ongoing and 32,707 analyses that were completed. Statistical analysis revealed that the number of elapsed days needed to complete a NEPA analysis (not including time in litigation after it was signed) declined by approximately four days per year from 2005 to 2019, and also indicated that the numbers of days to complete the three analysis types were significantly different. The estimated time to complete a CE was 193 days, the EA required 519 days and an EIS required 1,082 days (Morgan et al. 2021).
From a practical standpoint, the decline of four days per year seems relatively small – it is less than one work week for analyses that take an average of six months to three years to complete.
Choosing the correct NEPA analysis type is critical, especially considering time and effort invested. If a CE can be used rather than an EA, the time saved is almost a year; and if an EA can be used in place of an EIS, the time saved would be more than 1.5 years. Given the cost of a NEPA team can range from $500,000 to $1 million per year, the time saved by using a CE in place of an EA, or an EA in place of an EIS could also represent a substantial cost savings. For example, if a CE is the appropriate tool, then the USFS could save approximately a year’s worth of NEPA analysis time versus using an EA. If it costs approximately $500 per acre to plant trees in Montana and northern Idaho, the opportunity cost of not using the correct NEPA analysis type is equivalent to not planting trees on 1,000 to 2,000 acres. This would represent an important on-the-ground accomplishment, funded by the analysis cost savings.
Litigation
The use of NEPA analyses in litigation against NFS management activities is well documented (Keele et al. 2006; Miner et al. 2010, 2014; Morgan and Baldridge 2015; Mortimer et al. 2011), and thus differences in litigation rates are worthy of some attention.
By analysis type, about 15% of the EISs, 2% of EAs, and 0.4% of the CEs completed between 2005 and 2019 were litigated (Table 1; Morgan et al. 2021). Projects with certain land management purposes appear to be litigated more often, regardless of analysis type. The most frequently litigated project purposes are forest products in 95 of 292 litigated analyses (32.5%), fuels management in 92 (31.5%) of litigated analyses, and vegetation management – nonforest products in 83 (28.4%) of litigated analyses. By analysis type, litigation frequency and rates vary, but forest products, fuels and vegetation management are consistently among the most frequently litigated project purposes or among those with the highest litigation rates. Grazing management and road management also have relatively greater litigation rates (Morgan et al. 2021).
There are striking differences in litigation by USFS region (Table 1; Morgan et al. 2021). The Northern Region (R-1) has the highest number of total litigated analyses, accounting for 25.7% of all litigated analyses nationally. Likewise R-1 has the highest overall litigation rate, with 2.3% of all R-1 NEPA analyses litigated, which is more than 2.5 times the national rate of 0.9%.

The Southwestern Region (R-3) has the most litigated CEs at 37.2% of all litigated CEs nationally. The R-3 CE litigation rate is more than four times the national CE litigation rate. R-1 has the most litigated EAs (29 of 101 litigated nationally) and the highest EA litigation rate (7.6%). That is 3.8 times the national EA litigation rate of 2%. R-1 also has the most litigated EISs at 23 of 78 litigated nationally (29.5%). Further, R-1 has the highest EIS litigation rate with 29.1% of all R-1 EISs litigated.
The seemingly low rates of litigation underestimate the on-the-ground impacts to USFS programs and R-1 projects are the most frequently litigated among the USFS regions (Morgan and Baldridge 2015; Morgan et al. 2021). According to USFS officials, the R-1 timber program has had 210 to 466 million board feet of timber – or an estimated 18,000 to 41,000 acres of treatment area – associated with some phase of litigation. That is roughly equivalent to 50% to over 100% of the region’s annual timber program impacted by litigation between 2016 and 2021. Even when a project is not directly enjoined by a lawsuit, the work associated with responding to litigation is significant and takes personnel away from their planned program of work, representing additional opportunity costs to the agency.

Conclusions
This study suggests that more NFS land management is being accomplished per NEPA analysis (Morgan et al. 2021). Likewise, flat NFS budgets along with increasing accomplishments and declining numbers of NEPA analyses suggest the USFS is improving its acres treated per dollar appropriated to some mission areas, and may be reducing dollars spent per NEPA analysis. However, there is not strong evidence of increased speed in conducting NEPA, with just a four-day-per-year decrease in time-to-completion.
The USFS may be spending fewer congressionally appropriated dollars on NEPA, or it may be spending more on NEPA while accomplishing more on the ground with funding from partners, timber sale revenues and stewardship contracting. However, without a cost accounting system that identifies and tracks personnel and operating expenses associated with NEPA analysis versus other administrative or on-the-ground activities, measuring NEPA costs will remain imprecise at best. The necessity of conducting environmental analysis does not make the costs of NEPA irrelevant. Time and funding used to conduct or defend NEPA analyses represent opportunity costs to the USFS and every dollar spent on NEPA is a dollar not spent accomplishing on-the-ground activities.
We appreciate the help provided by U.S. Forest Service personnel providing and interpreting data, and understanding agency processes.


