It has been said that many people only care about the power system when they are experiencing a power outage. Electricity customers have come to expect that power will be available when they need it most – and at a cost that is “reasonable.” That expectation has been met, almost without exception, by Montana’s power providers.
However, the largest electric utilities serving our state are sounding the alarm that they may be “resource deficient” – possibly within the next few years (NWE 2020; MDU 2020). This concern likely extends to some of the smaller, local electricity cooperatives that provide power to the remainder of the state. Montanans are concerned that the situations that recently played out in states like California and Texas, which suffered significant economic damage from widespread power outages, could happen here one day.
And the challenges we collectively face in maintaining reliable, reasonably priced electricity are growing. These challenges include:
- the planned retirement of power plants across our region,
- increasing demand for electricity within Montana and beyond,
- the significant deployment of intermittent renewable sources of electricity,
- minimal participation in energy efficiency and demand response programs,
- decreasing electricity generation and little new capacity of utility-scale power generation has been built,
- volatile wholesale electricity markets, and
- a limited number of congested transmission lines connecting Montana with regional power markets.
Ensuring that Montanans will continue to enjoy reliable, inexpensive and sustainable power is a complicated and often political decision, but one that has important implications for the future of our state’s economy and people. Unfortunately, the process of identifying the electricity needs of Montana customers and procuring new electricity resources is extremely time-consuming – often taking years (Carvallo et al. 2019). Not addressing these challenges may expose customers to volatile electricity prices and, in some places, power disruptions.
Assessing the Situation
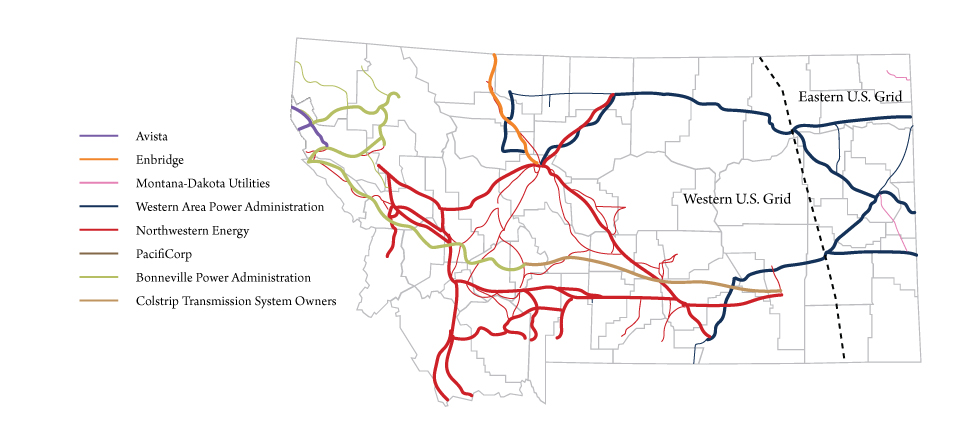
It is simple to turn the lights on in a room, but the markets, technology and infrastructure that bring power to that lightbulb are complex and years in the making. The electricity sector is an intricate, interconnected system where regulated utilities, power marketers and independent power producers buy and sell power from other companies that serve customers located within a state, region or beyond. Montana is one of a small number of states that straddles both the Eastern and Western U.S. electricity interconnections – or major electricity grids (see Figure 1). Balancing authorities operating within these interconnections help match electricity supply with demand ahead of time – and in real-time, maintain the quality of power.
Perhaps the most basic purpose of the power grid involves matching supply – the electricity that is generated by all sources and delivered – to end-use demand at every moment of the day and every day of the year. For physical goods, when demand exceeds supply, consumers will see largely empty store shelves and high prices. For electricity, which cannot easily be stored, it is possible that customers could experience widespread, long-duration power interruptions as well as high prices.
 Figure 1. Montana transmission lines and interconnection boundaries. Source: Montana Legislature, 2020.
The importance of avoiding that outcome is perhaps obvious, but the recent experience of the two most populous states should teach us that decision-makers do not always keep their eye on this all-important target. For this reason, the University of Montana Bureau of Business and Economic Research (BBER) has commissioned a series of papers to independently and comprehensively evaluate this critical issue confronting our state. The Montana Electricity Reliability Initiative (MERIT) is a year-long project that will explore all facets of Montana’s electricity system, including identifying both challenges and opportunities that key stakeholders and the general public could face. Our goal is to produce actionable research that is accessible to a broad audience with an interest in Montana, ranging from utility staff to policymakers to small business owners.
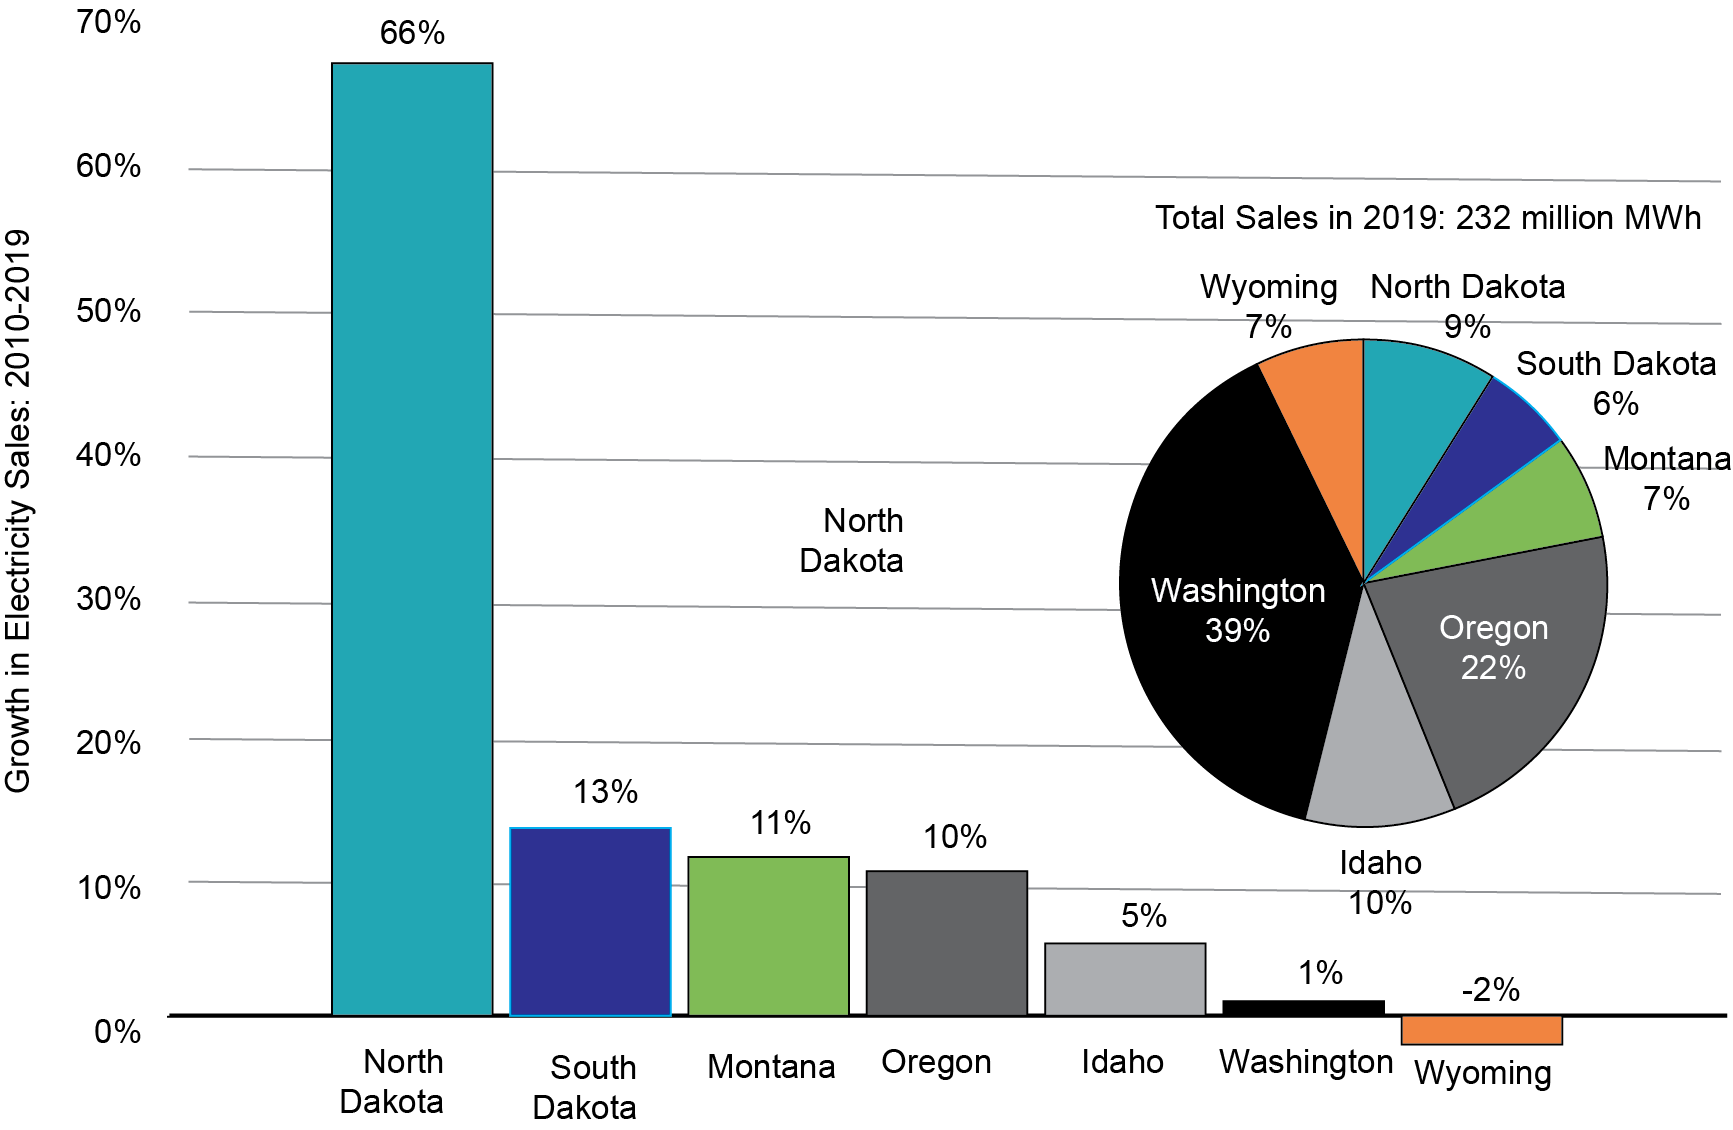
Figure 2. State by state historical growth rate and overall share of sales.
Source: U.S. Energy Information Administration, 2020.
What Are Montana’s Electricity Needs?
Over the past decade, the electricity consumed by Montana customers has increased by about 11% (Figure 2). But there is considerable variability in electricity sales for states across our region over this same time period.
The clear outlier is North Dakota, where explosive growth in oil production pushed its electricity sales up by 66% through 2019. On the other end of the spectrum, electricity sales were essentially unchanged in Washington, the largest economy in the region. As a group, the electricity sales of all the states shown in Figure 2 increased by more than 8% when the initial effects of the pandemic are removed (2010-2019). In Montana, electricity sales grew 4% for the full decade and 11% when not including 2020.
In 2020, industrial and commercial electricity sales throughout the U.S. dropped significantly due in large part to the economic downturn caused by the pandemic. At the same time, electricity sales to residential customers increased as more employees worked from home during this period. In general, though, the pandemic led to a general decrease in total electricity sales across Montana – the drop in commercial and industrial sales was larger than the increase in sales to residential customers. But adequacy of supply requires meeting demand exactly at the time it occurs, and there is considerable variability of demand by season, day of the week and hour of the day. Peak demand, defined as the maximum load on the system (measured in megawatts), can grow faster than annual electricity sales. This can occur, for example, if customers are demanding more electricity by running air conditioners in late summer afternoons when system demand is already high.
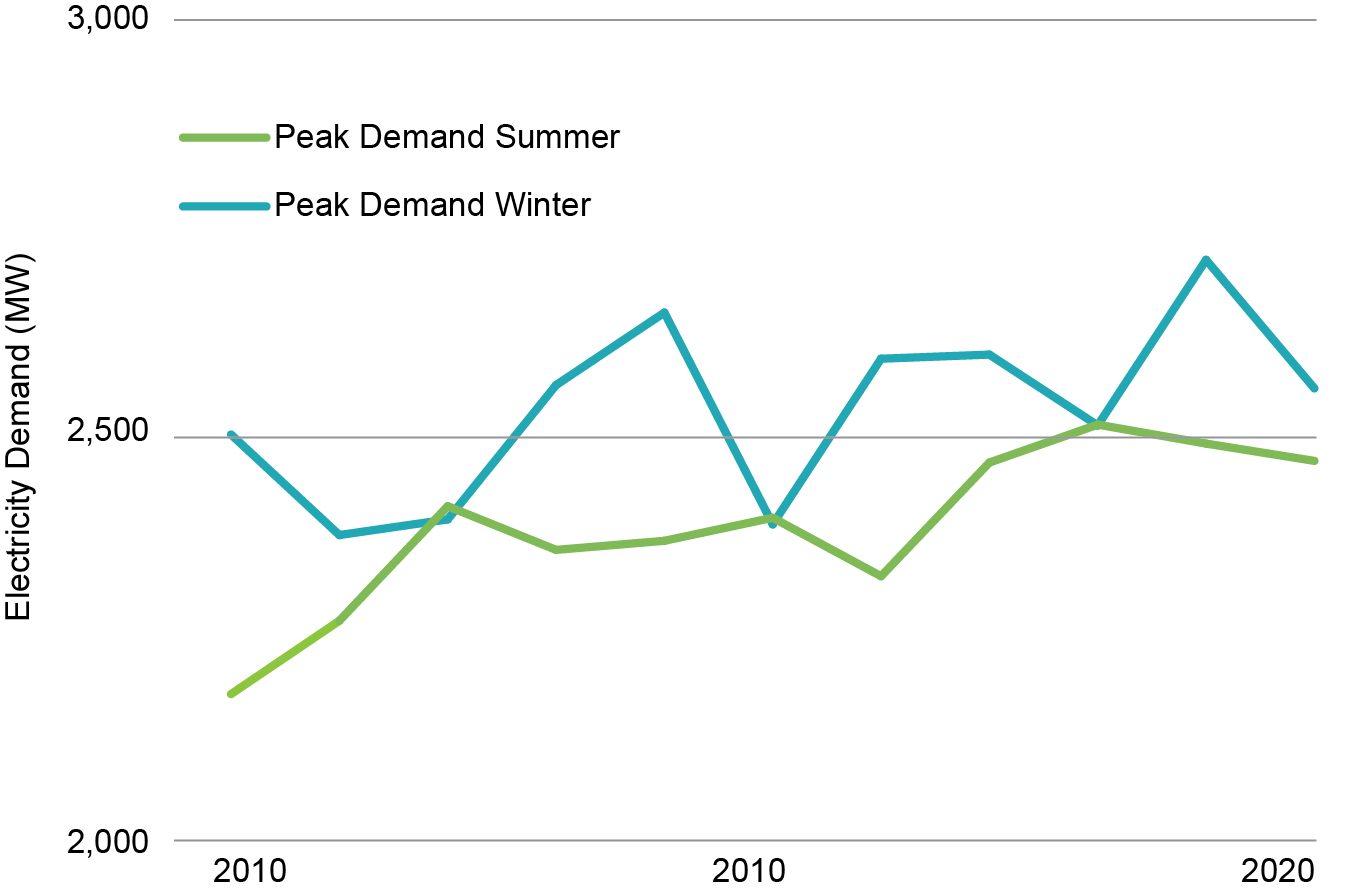
Figure 2. Estimate of peak electricity demand for Montana (2010-2020).
Source: Federal Energy Regulatory Commission, 2022
Figure 2. Annual number of electric vehicle and all vehicle registrations in Montana (2010-2020).
Sources: EV Hub, 2021 and Montana Motor Vehicle Division, 2022.
Peak demand has important implications for decisions involving future supply- and demand-side resources, including power imported from outside of Montana. Given its importance, we estimated peak demand using publicly available information reported by utilities to the U.S. government or to the Montana Public Service Commission.
From 2010 to 2020, Montana’s peak demand increased by about 13%, with peak demand in the summer growing faster than winter peak demand (see Figure 3). In Montana, peak demand typically occurs between 4 p.m. and 6 p.m. in any given day. Northwestern Energy, for example, reports that peak demand in the winter (December-March) typically occurs around 6 p.m. and around 4 p.m. in the summer (July-August) (NWE 2020).
What is Driving these Increases in the Demand for Electricity?
The primary factors that drive demand for electricity include population, economic activity, energy efficiency of homes, businesses, and equipment, weather and technology adoption. Local, state, and federal government policies – as well as the retail price of electricity – also have an impact on electricity demand, but the impacts of these policies are often indirect in that they have an influence on the primary factors. For example, the Montana Public Service Commission, which is a regulatory body, approves the rates of electricity that regulated utilities (e.g., Montana-Dakota Utilities, NorthWestern Energy) can charge its customers. These rates then have some influence on demand for electricity.
Many of these factors driving demand are slowly evolving. Population and overall economic growth have pushed up both total electricity sales and peak demand. Energy efficiency investments, both in homes and businesses, especially in lighting and building design, have continued to reduce the energy intensity of both new and existing structures. But the uptake of these programs has remained relatively stagnant in recent years. And gradually warming temperatures are fostering a shift of Montana from a winter to a summer peaking system, thanks to increased usage and adoption of air conditioning.
But there are less predictable, disruptive events as well, both in the past and, potentially, in the future. The closures beginning in the late 1990s of the aluminum smelters cut industrial demand by half in the late 1990s to mid-2000s. As already noted, the Bakken oil boom increased electricity sales in North Dakota by 66%.
The introduction and adoption of electric vehicles (EVs) looms as a potentially important source of demand growth in the coming years. While tiny in comparison to the overall market, the number of EVs registered in Montana has seen exponential growth in recent years (Figure 4). The recently enacted infrastructure bill’s goal of 500,000 public charging stations by 2030 could significantly increase EV adoption and place new demands on the power system.
The Changing Regional Marketplace
The interconnected nature of the electric power grid makes changes occurring in other states relevant here, especially if they cause other states and Canadian provinces to rely more on regional markets for their power needs. California is the largest electricity importing state in the country, purchasing 28% of its power from other states in 2019. Montana, by contrast, remained a net electricity exporter on average in that year (which pre-dated the closure of two units at the Colstrip coal-fired power plant). But there are many times when Montana’s needs exceed the supply provided by power plants within our state, and this shortfall is made up by purchasing electricity from out of state.
Demand is just one part of the picture, of course. Future MERIT reports will detail the trends, challenges, and options for generating and delivering the power to meet future needs of Montana consumers. It’s an issue that households and the economy have a huge stake in, and this project aims to keep them better informed.
References
– Carvallo, J.P., A. Sanstad, and P.H. Larsen, 2019. Exploring the Relationship Between Planning and Procurement in Western U.S. Electric Utilities. Energy 183, 4-15. Accessible at: https://doi.org/10.1016/j.energy.2019.06.122
– Electric Vehicle (EV) HUB, 2021. Montana Electric Vehicle Registrations by Registration Year. Accessible at: https://www.atlasevhub.com/materials/state-ev-registration-data/
– NorthWestern Energy (NWE), 2020. 2020 Supplement to the 2019 Electricity Supply Resource Procurement Plan, December. Filed with the Montana Public Service Commission. Accessible at: https://psc.mt.gov/
– Montana-Dakota Utilities (MDU), 2020. 2019 MDU Integrated Resource Plan Fact Sheet, January 24. Filed with the Montana Public Service Commission. Accessible at: https://psc.mt.gov/
– Montana Legislature, 2020. Map created by Montana Department of Environmental Quality for Energy and Telecommunications Committee Meeting, July 15. Accessible at: https://leg.mt.gov/content/Committees/Interim/2019-2020/Energy-and-Telecommunications/Meetings/July-2020/Exhibits/July15/Exhibit1.pdf
– Montana Motor Vehicle Division (MVD). 2022. MVD by the Numbers. Accessible at: https://dojmt.gov/driving/mvd-by-the-numbers/
– U.S. Energy Information Administration (EIA), 2021. Electric Utility Data Collected from EIA Form 861. Accessible at: https://www.eia.gov/electricity/
– U.S. Federal Energy Regulatory Commission (FERC), 2022. FERC Form 714: Annual Electric Balancing Authority Area and Planning Area Report. Accessible at: https://www.ferc.gov/industries-data/electric/general-information/electric-industry-forms/form-no-714-annual-electric/data
Peter Larsen is a research fellow, Patrick M. Barkey is the director and Derek Sheehan is an economist at the Bureau of Business and Economic Research at the University of Montana.


